Objective
The primary objective of this blog is to demonstrate techniques used to customize open-source large language models (LLMs) for analyzing time series data and evaluate the effectiveness of Generative AI (GenAI) based pipelines in enhancing data analytics platforms such as Splunk, Grafana, and InfluxDB. In this blog, we aim to provide a comprehensive exploration of using small language models (SLMs) in predictive maintenance and data analytics tasks, offering actionable insights into their integration strategies, data processing capabilities, and performance across different hardware platforms. We will delve into practical use-cases that demonstrate how LLMs can enhance data-driven decision-making and drive innovation across industries. We will also dive into the critical process of synthetic data preparation and its role in fine-tuning open-source foundational language models like Mistral and Llama. The discussion will include a detailed analysis of embedding LLMs into existing 3rd party analytics ecosystems, addressing both operational challenges and technical implementation steps, and will culminate in a comparative performance assessment of inference pipelines running on RISC-V based Esperanto Chip (ET-SoC-1) energy efficient accelerators and traditional GPU architectures, evaluating key metrics such as execution time, power consumption, memory usage, throughput, and accuracy.
Limitations of Traditional Data Analytics Pipelines
The current landscape of industrial error management and predictive maintenance is fraught with significant challenges that impede operational efficiency and technological advancement. Existing systems suffer from inefficient error categorization processes that heavily rely on manual user intervention, leading to time-consuming and error-prone debugging scenarios. Traditional predictive models often provide superficial machine failure predictions without delving into the underlying root causes of equipment malfunctions. Moreover, data analysis remains complex and inaccessible, requiring specialized expertise to navigate and interpret intricate data visualizations, which creates substantial barriers to actionable insights.
In response to these challenges, our proposed solution leverages customized language models to revolutionize operational workflows and predictive maintenance strategies. By automating error categorization and providing sophisticated debugging solutions, we aim to dramatically reduce the resources and time traditionally spent on manual troubleshooting. Our innovative pipeline transcends conventional prediction models by offering deep, contextual insights into potential failure mechanisms, thereby facilitating more accurate forecasting and preemptive maintenance actions that can significantly reduce operational downtime and associated costs. Central to this approach is an AI-driven interactive question-answer system integrated directly into the dashboard, which empowers users to extract immediate, context-aware insights without requiring advanced technical interpretation skills.
Use Case Overview
We use a Generative AI based pipeline to develop a comprehensive preventive maintenance system which monitors and detects the health of the Esperanto Server Platforms. By identifying critical monitoring parameters such as system temperature, power consumption, computational throughput, and hardware component performance metrics, we develop a sophisticated approach to breaking down complex operational insights into granular, actionable components. The pipeline involves collecting real-world and synthetic training data and employing data augmentation techniques to create robust, representative datasets that can effectively train SLMs. Our methodology focuses on developing a holistic framework for assessing server health and efficiency, incorporating uni-modal data analysis techniques that leverage open-source large language models to transform raw performance metrics into intelligible, predictive insights. The validation process rigorously evaluates model performance through comprehensive benchmarking, examining key metrics like inference accuracy, computational efficiency, and the model’s ability to generalize across diverse operational scenarios.
Inference Pipeline
We propose a GenAI based inference pipeline as outlined in Figure 1. The operational data is collected from respective Esperanto servers and then preprocessed. This preprocessed data is fed into a fine tuned “Cause Analyzer LLM” Mistral based LLM model, which identifies errors, categorizes them, and suggests debugging solutions. The enriched output is then inputted into another Mistral fine tuned LLM called the “Time Series Predictor LLM”, which forecasts future failure probabilities and pinpoints potential causes. Both LLMs run on high-performance accelerators, such as GPUs or Esperanto cards, ensuring efficient processing.
Figure 1: Proposed GenAI Based Time Series Data Analytics Pipeline
The predictions generated by the Time Series Predictor and pre-processed data are stored in InfluxDB, a specialized time-series database. For real-time analysis and operational monitoring, this data is visualized on a Splunk dashboard, where it is accessible through interactive graphs and charts. Additionally, a sophisticated Question and Answer system, hosted on an accelerator—either GPU or Esperanto card—facilitates dynamic interaction with the dashboard, providing users with immediate, context-aware responses to inquiries, enhancing decision-making processes.
System Architecture Overview
The rationale for choosing Large Language Models (LLMs) in predictive maintenance is rooted in their unparalleled ability to process and comprehend complex textual data. Unlike traditional machine learning models, LLMs excel at extracting and synthesizing nuanced information from diverse sources such as error logs, maintenance records, and operational notes.
When compared to traditional machine learning models, LLMs demonstrate significant advantages in handling diverse data types. While conventional models typically excel in numerical data analysis, LLMs can understand and generate human-like text, providing a holistic approach to data interpretation. Their transfer learning capabilities allow them to leverage pre-trained models across vast datasets, enabling more efficient and adaptable fine-tuning for specific tasks.
The selection of InfluxDB and Splunk as complementary tools in this inference pipeline was strategic and purposeful. InfluxDB was chosen for its exceptional performance in handling time-series data, offering rapid write and retrieval capabilities that are crucial for real-time performance monitoring. Splunk complements this by providing powerful data aggregation, analysis, and visualization tools that can process large volumes of log data and generate insightful, real-time monitoring dashboards. The integration of these tools can be achieved through direct API connections, middleware solutions, and custom scripting, each offering unique advantages in facilitating seamless data communication and processing.
Integrating LLMs to the Data Analytics Tools
This section describes how our fine tuned LLMs interact with and leverage data from InfluxDB and how the processed insights are subsequently visualized and analyzed using Splunk. The integration ensures a seamless flow of data and enables real-time analytics capabilities.
A client is instantiated with parameters such as URL, token, and organization details for InfluxDB, allowing secure and customized access to the database. Data is queried from InfluxDB using a Flux query. This step involves retrieving the required datasets for analysis, structured to include essential metrics and identifiers. Before sending data to Splunk, it is essential to ensure it adheres to the format Splunk expects. This might include converting timestamps to ISO 8601 format and handling null values. Proper authentication headers are set up to ensure secure data transfer to Splunk, utilizing an authorization token. The LLM is hosted on a dedicated server, ensuring reliable performance and availability. An API endpoint is created to facilitate communication between the LLM and the Splunk dashboard, allowing the LLM to receive and process queries. A custom app is developed within Splunk, which acts as the intermediary, handling requests and responses between the Splunk user interface and the LLM. The script is configured in the ‘commands.conf' file within Splunk. This configuration ensures that any user query entered on the dashboard triggers the LLM API to fetch the response. Responses generated by the LLM are stored in a designated Splunk index. This approach ensures that all interactions and outputs are logged. Responses are retrieved using Splunk Processing Language (SPL) and displayed on the dashboard. This setup allows users to see real-time results from their queries.
And finally, we develop a prototype dashboard which provides a comprehensive and intuitive insight to server performance we are monitoring, featuring a time-series graph with dynamic color coding that instantly communicates server efficiency levels. This visualization is complemented by an interactive component impact analysis feature to drill down into specific server elements, providing granular insights into individual component contributions to overall system performance. To further enhance user experience and data accessibility, the dashboard integrates an advanced LLM-powered question-answering. Underpinning these features is a robust, customizable alert system designed to proactively notify users of significant efficiency fluctuations, thus transforming server monitoring from a reactive to a predictive and strategic operational approach.
Figure 2: Prototype Dashboard Showing the Implementation of the Analytics Pipeline Under the Hood
Training Pipeline Overview
Based on the inference pipeline above for implementing an Esperanto server based preventive maintenance system, we would need to train 2 separate LLMs: a first model which will identifies errors, categorizes them, and suggests debugging solutions and a second model which forecasts future failure probabilities and pinpoints potential causes.
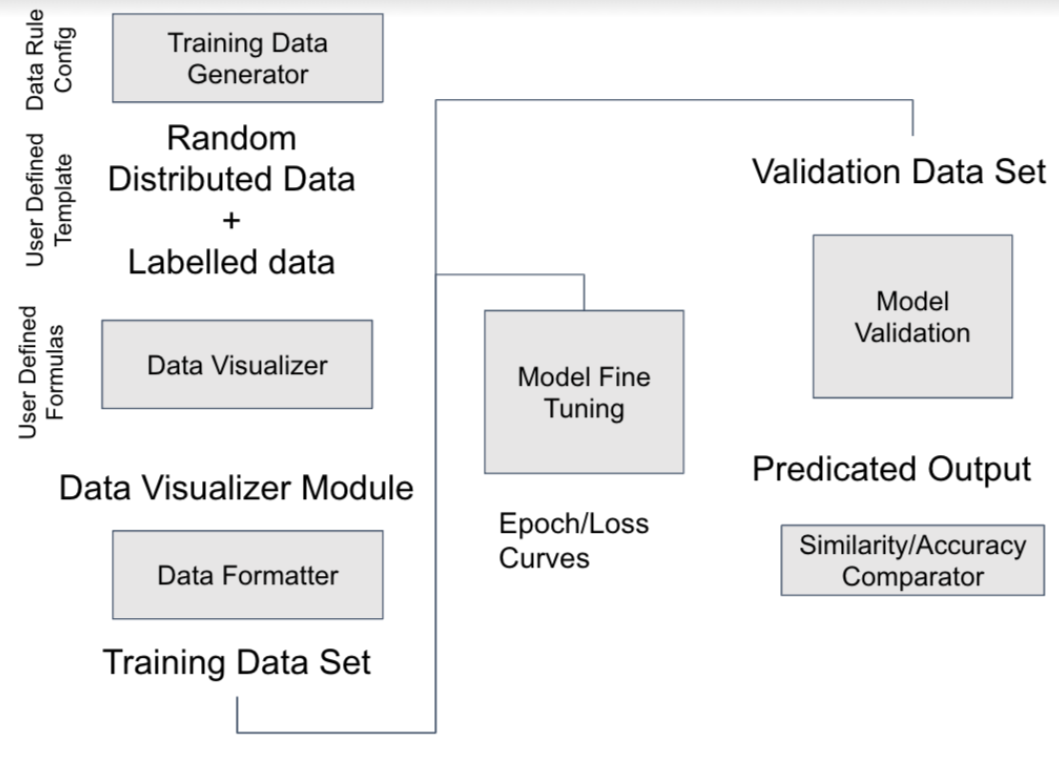
Figure 3: Overall Training Pipeline
For the first “causal model”, we collected log data from Esperanto servers. The data below is Esperanto server logs which has a manually created debugging cheatsheet containing error and cause of different error symptoms.

Figure 4: Sample Labeled Error Symptom / Cause
For cases where the labels were not available, we utilized GPT-4 to label the data with appropriate error classifications. This process involved feeding GPT-4 contextual information specific to our server operations and trying different prompt to ensure that the labeling was both accurate and relevant.
GPT-4 was also used to generate synthetic logs that resemble our server logs. Additionally, we employed back-translation technique to increase the number of logs from 85 to 170. This method is particularly effective in diversifying the linguistic expressions without altering the underlying meaning.
The dataset was split into a 90:10 ratio for training and validation. The table below shows an example of the generated dataset
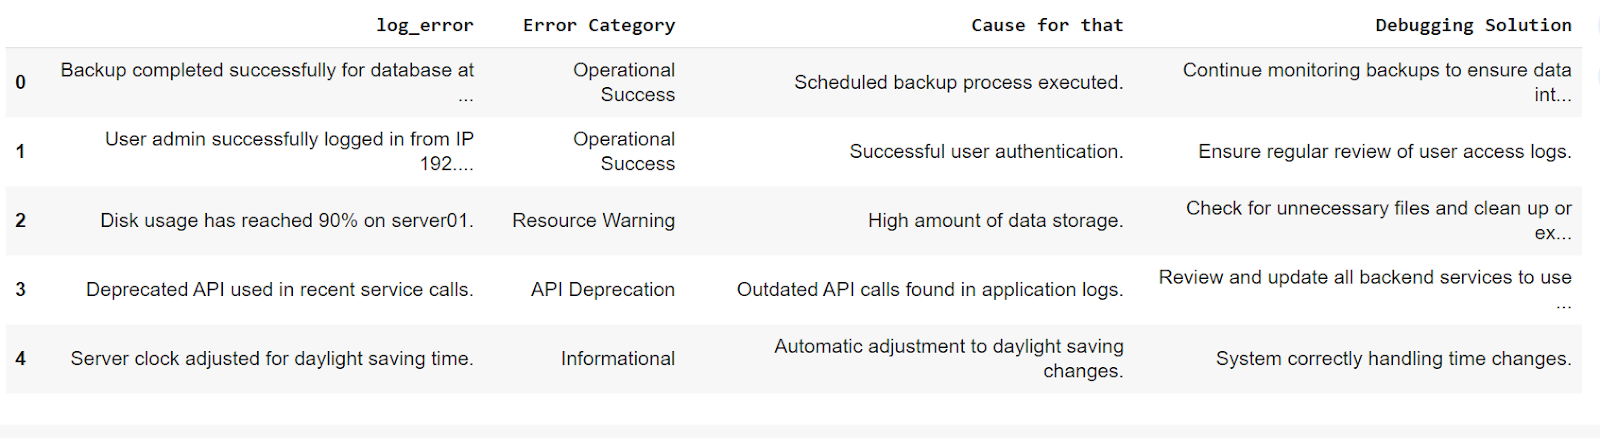
Figure 5: Sample Generated Dataset
The fine-tuning was conducted using the Mistral 7B and Llama-3 8B models, chosen for their effectiveness in handling the complexity of log data. The primary objective during fine-tuning was to enhance the model’s precision in categorizing errors and diagnosing causes, tailored to the nuances of data from Esperanto servers. Sample LLM prompt used: For the given log_error from my server data, Categorize the log into errors, Identify the Cause and Provide Debugging Solution
Model Evaluation
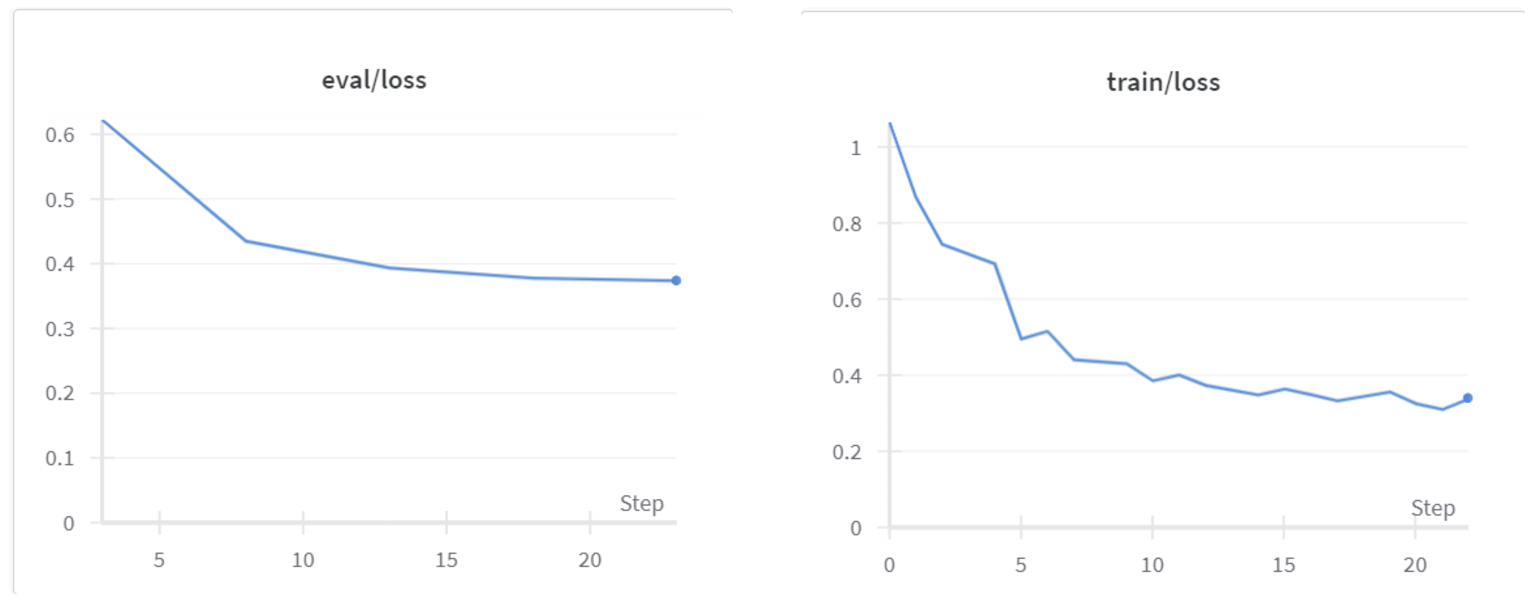
Figure 6: Model’s Learning Progress
The plots shown provide a clear visual representation of the model’s learning progress over five training epochs. The right graph, depicting training loss, shows a significant reduction in loss from initially near 1 to less than 0.4, indicating that the model is learning from the training data. The left graph, showing evaluation loss, also depicts a steady decrease, dropping from about 0.6 to around 0.3, which suggests that the model is generalizing without overfitting.
We then employed cosine similarity to evaluate the model’s accuracy, focusing on how closely the model’s output for predicted causes aligns with the manually labeled causes.
| Models | Cause (Similarity Score) | Error Category (Accuracy) |
| OpenAI (GPT 4o) | 72.39 | N/A |
| Mistral 7b | 51.91 | 46.23% |
| Llama3-8b | 44.76 | 41.76% |
| Finetuned Mistral 7b | 67.15 | 70% |
| Finetuned Llama3 | 55.89 | 60% |
Figure 7: Comparison of Performance of Different Closed and Open Source Models Against Our Fine Tuned Model
The results illustrated above were obtained using a limited dataset. Despite the small data size, the fine-tuned models—Mistral 7B and Llama 3—show promising improvements, with similarity scores for causality analysis and accuracy for error categorization markedly increasing post fine-tuning. This indicates a strong potential for these models to achieve significantly better performance as the dataset size increases.
The second “predictive” model relies on a synthetic data generation process designed to simulate real-world operational scenarios. This involves several techniques and customizable elements. A high level overview of the training process is depicted below.
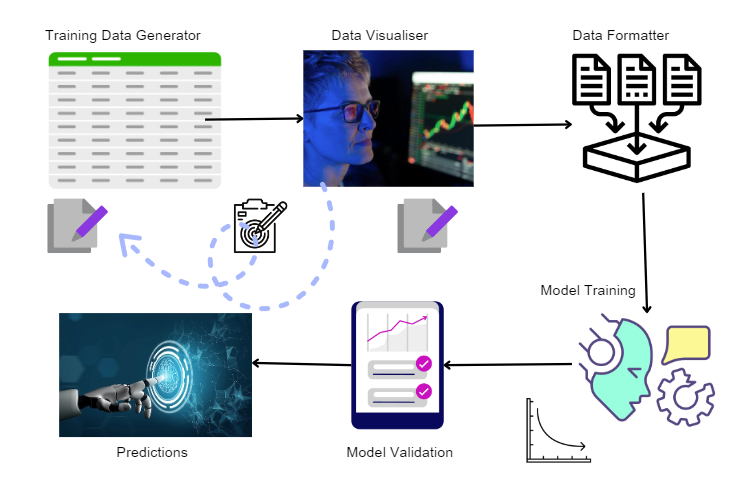
Figure 8: Overview of Predictive Model Training Process
First, we generated synthetic data which resembles the Esperanto server metrics logs data.
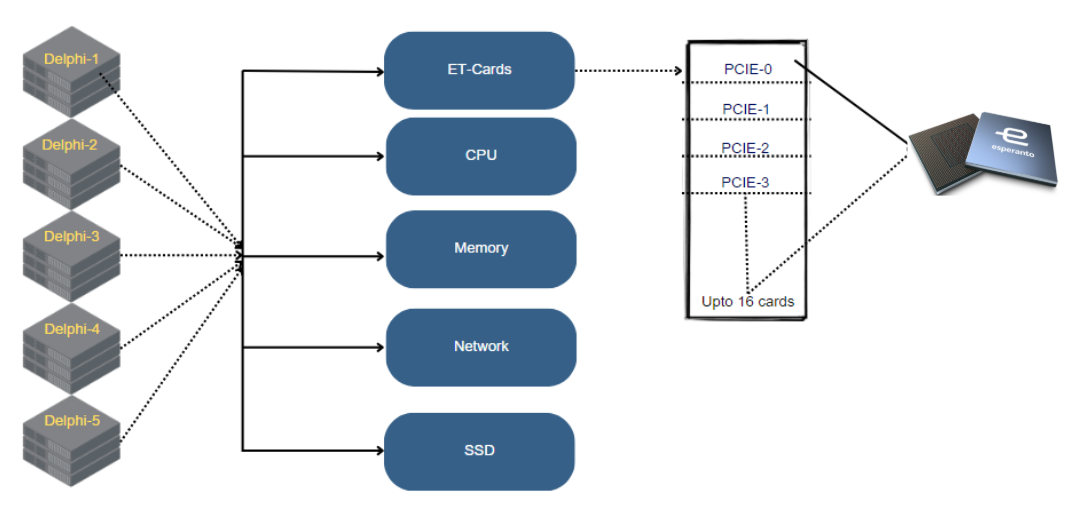
Figure 9: Esperanto Server Data Hierarchy for Upto 16 Cards Per System
In the context of Esperanto server systems, effective monitoring focuses on capturing data that reflects the operational health and efficiency of each server component. These components include the ET-Cards, CPU, Memory, Network, and SSD, which are crucial for the performance of each Delphi server unit connected to an ET-SoC via multiple PCIe channels.
Users can leverage templates to define the structure and nature of the data according to specific needs or operational characteristics. These templates provide a starting point that can be further customized to closely reflect the complexity and variability of different machine behaviors. All parameters involved in data generation, such as range, frequency, and type of data points, are fully configurable. A dedicated configuration file allows users to easily adjust these settings, enabling them to model various scenarios without modifying the underlying code. To capture the cyclical nature of machine operations, synthetic data incorporates mathematical models like the cosine function (cos(2π + x)), which helps in simulating periodic patterns observed in real machine data. The generation algorithm ensures that the value of a parameter at a given time is influenced by its immediate predecessor, mirroring the dependency and response behavior typical in mechanical systems. Data points are categorized into different zones—green, yellow, and red—reflecting operational risk levels or efficiency statuses, with a distribution ratio of 7:1:2.
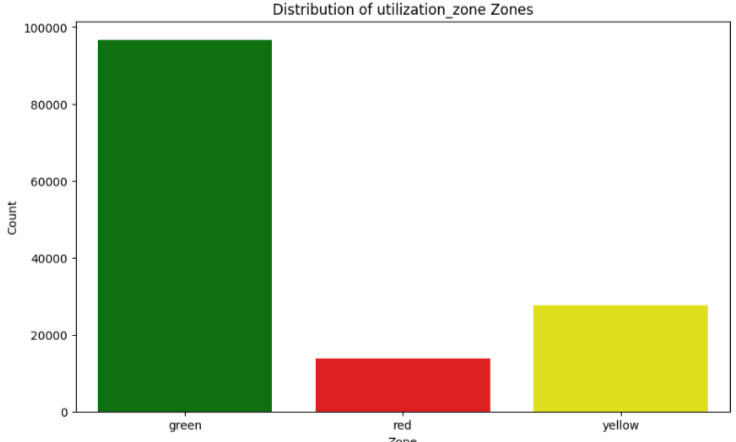
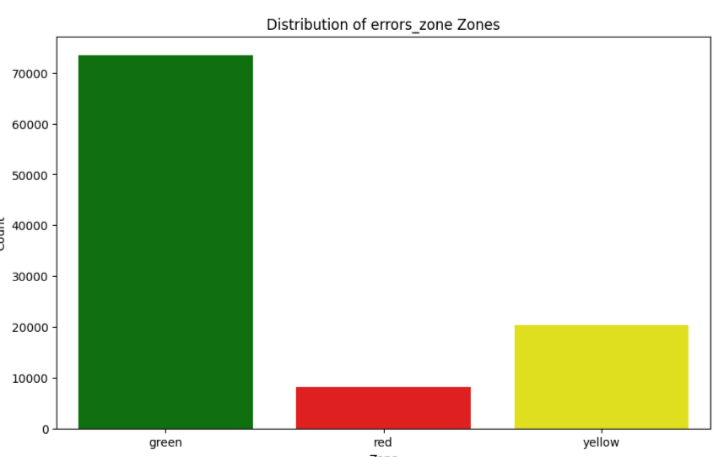
Figure 10: Distribution of Zones Reflecting Operational Risk Levels or Efficiency Statuses
Users can adjust the thresholds and definitions of these zones in the configuration file.
The Data Visualizer Module is a pivotal component of our analytics suite, designed to provide users with intuitive and powerful tools to examine and interpret the synthetic data generated for training the predictive models. Following plots helps you understand the data distribution after calculating the efficiency using all metrics we generated synthetically.
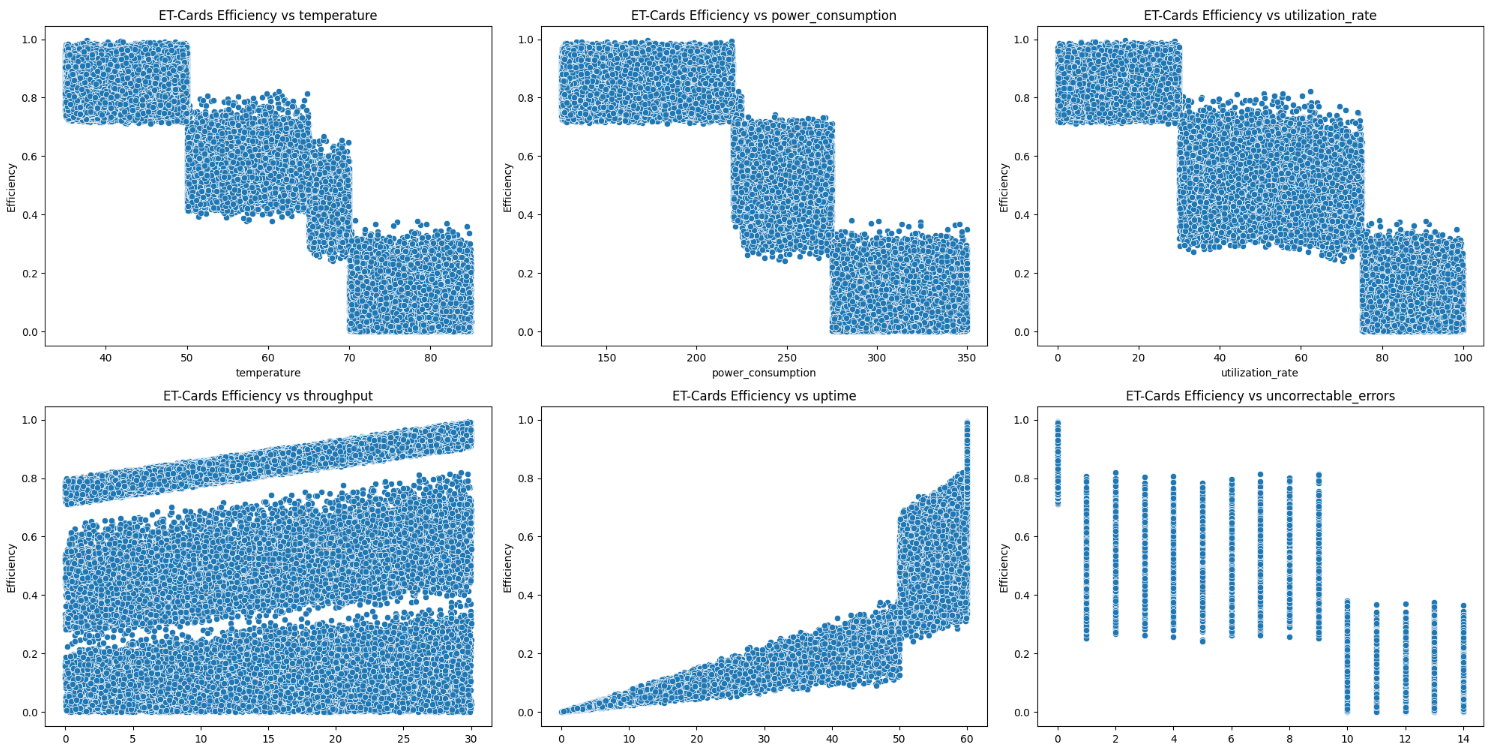
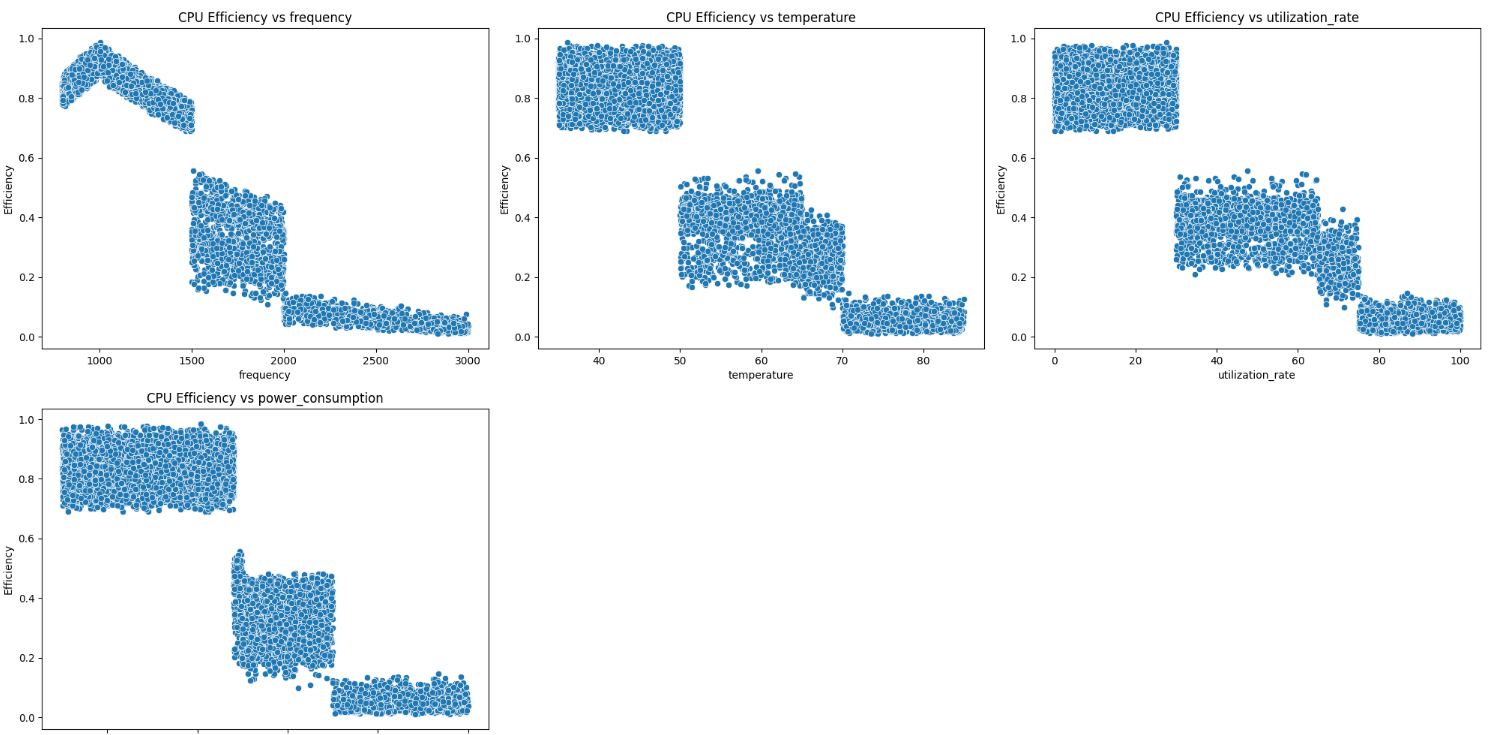
Figure 11: Data Visualizer Output for the Different Parameters Evaluated
The module enables the visualization of trends within the data, helping users to identify consistent patterns or shifts over time. Users can analyze the degree of randomness in the data as well as the correlations between different variables. This analysis helps in understanding the interdependencies within the data and assessing whether the synthetic generation aligns with expected real-world dynamics.
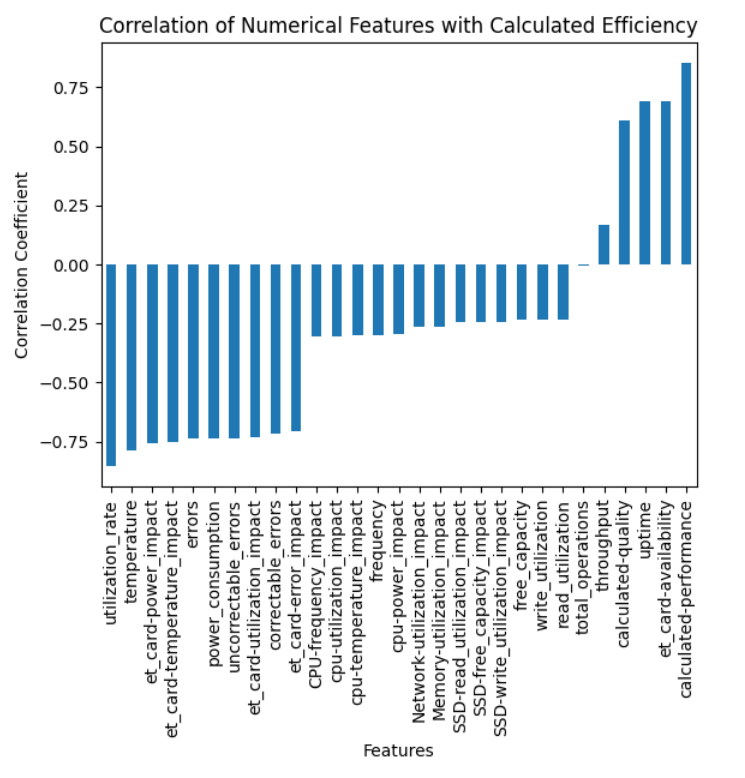
Figure 12: Feature Correlation Chart
If the initial analysis reveals discrepancies or areas for improvement, users can directly modify the configuration settings used in the data generation process. After making configuration changes, users can quickly regenerate the data and revisit the visualizations.
The Data Formatter Module plays a crucial role in preparing and enhancing the dataset for optimal training of our large language models. By integrating real-world error logs and converting numerical data into descriptive text, this module ensures that the LLMs can process and learn from the data effectively. Real error logs, along with their associated causes, are incorporated into the training dataset based on predefined conditions. This inclusion enriches the dataset with practical examples of failure scenarios. The module uses specific criteria to select and integrate real data points into the synthetic dataset. These criteria ensure the real data is relevant and adds value to the model training process by providing additional context and complexity. To make numerical data more comprehensible to LLMs, which excel in processing text, this module converts numbers into text. For example, temperature readings are transformed into descriptions that narrate changes over time, such as "temperature on day x has raised from a to b."
Data is prepared like the following for fine tuning. Failure probability here is calculated using metrics and efficiencies provided in the config file.
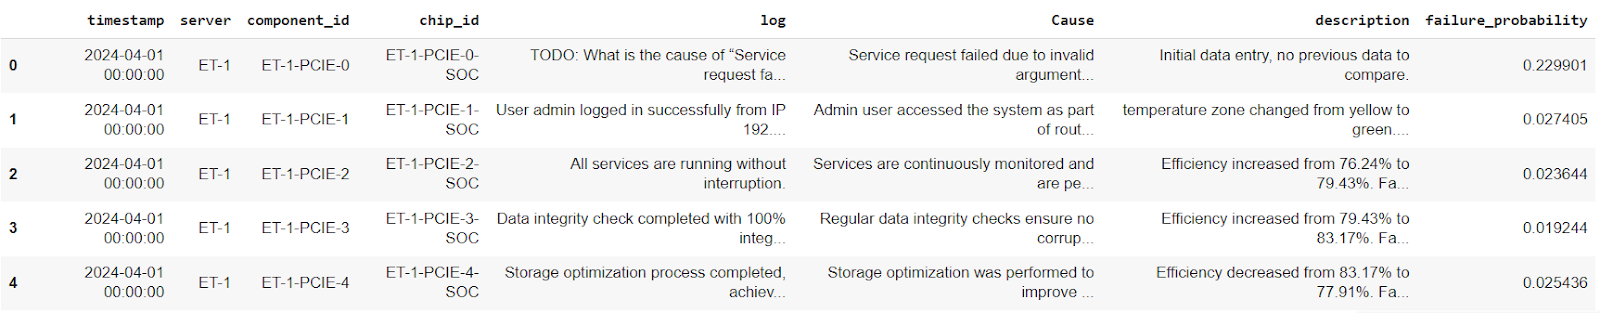
Figure 13: Sample Data Prepared for Fine Tuning
Then, we fine-tune our large language model on a meticulously prepared dataset, enhancing its capability to forecast future equipment failures and identify underlying causes. The training process incorporates extensive domain knowledge to ensure the model not only learns from data but also understands the operational context in which the data exists. A key element of our training strategy involves crafting prompts that incorporate both contextual information and domain-specific knowledge. This approach guides the LLM to focus on relevant aspects of the data, enhancing its analytical capabilities.
Example:
[Context]: Predictive maintenance data for the past {num_days_context} days.
[Domain Knowledge]: Monitoring server operations such as temperature, power consumption, and error rates helps in predicting potential failures which might affect server performance and availability. Analyzing historical data allows for anticipatory actions to minimize downtime and maintain system integrity.
[Task]: Predict the failure probability and potential causes for the next {num_days_to_predict} days based on the data provided.
Referencing the importance of historical data analysis allows the prompt to underscore the model’s role in identifying patterns that could indicate impending problems and enable preemptive actions. We utilized the Mistral 7B model, a powerful variant of transformer-based models. This model was sourced from Hugging Face’s Model Hub. To enhance the model’s training efficiency and adaptability without extensive computational overhead, we employed the LoRA (Low-Rank Adaptation) technique. This method allows us to fine-tune the model by adjusting only a small subset of model parameters. For real-time performance monitoring, we integrated Weights & Biases (wandb), which provided us with dynamic visualizations of training curves for each epoch. This tool proved invaluable in tracking changes in performance metrics over time and enabled us to make data-driven decisions quickly and effectively.
The graph illustrates the decrease in both training and validation loss over five epochs, indicating that the model is effectively learning and generalizing from the training data.
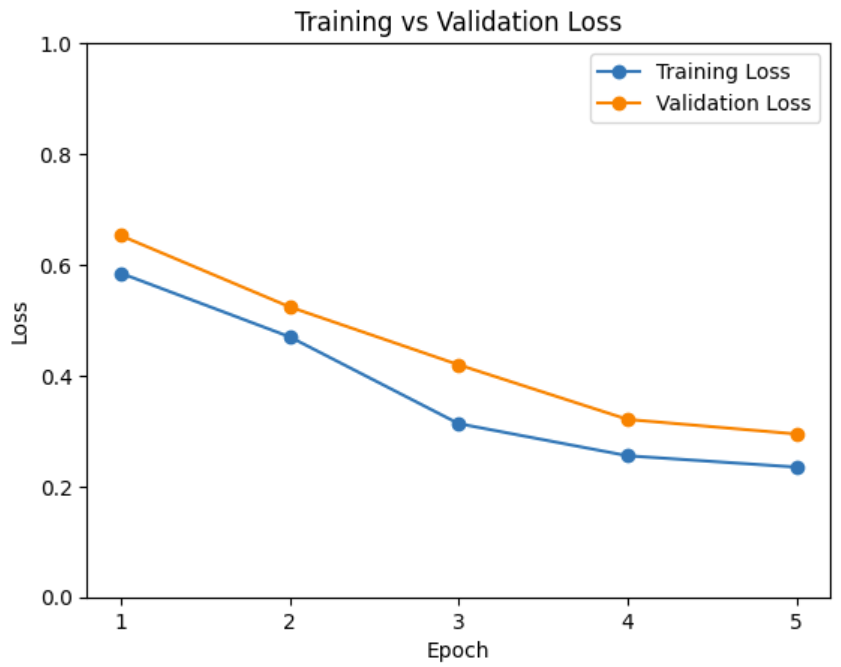
Figure 14: Training and Validation Loss of Model
The convergence and relatively close proximity of the training and validation losses towards the end of the training epochs suggest that the model is not overfitting.
The ability of the model to generalize is further evidenced by the validation loss closely tracking the training loss.
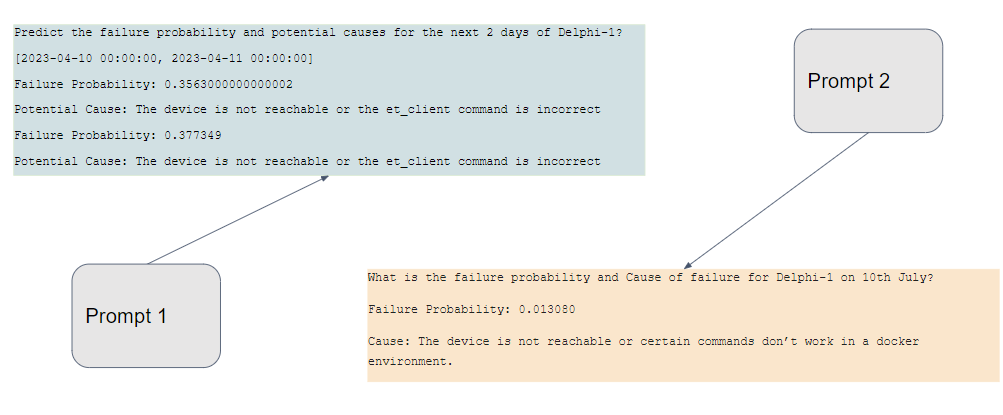
Figure 15: Example Prompts
Results
This section details the key metrics and parameters used to assess the performance and efficiency of our inference pipeline and the individual components within. These metrics provide valuable insights into the responsiveness, speed, and resource utilization of the system.
| Throughput (tokens/sec) | Device Memory (GB) | Power Consumption (Watt) | |
| Cause Analyzer Model | 58 | 55 | 208 |
| Time Series Prediction Model | 62 | 56 | 221 |
| Q/A System | 55 | 53 | 196 |
Figure 16: GPU (A100) Runtime Metric
| Metric | GPU (A100) | ET-SoC-1 |
| Power Consumption (Watt) | 208 | 27 |
| Throughput (No. of tokens/sec) | 58 | 11.5 |
| Energy Efficient Throughput (No. of tokens/sec/watt) | 0.278 | 0.423 |
Figure 17: ET-SoC-1 Against GPU (A100) Runtime Metric
Summary
The landscape of data analytics is being transformed by large language models through several key innovations. Researchers are focusing on streamlining the integration of LLM pipelines into existing third-party data analytics frameworks, which enables more seamless technological adoption. Simultaneously, advanced functionalities are being developed to implement interactive question-and-answer systems within these tools, allowing for deeper and more nuanced insights. A critical approach to enhancing LLM effectiveness involves utilizing synthetic data for specialized training. Moreover, ongoing performance comparisons are revealing scenarios where LLMs demonstrate superior capabilities compared to traditional time series analysis algorithms, suggesting a significant potential for disruption in data analytics methodologies.
As part of this effort, we exhibited how small language models can be integrated into existing data analytics platforms. We developed integration techniques that incorporate LLM pipelines into existing third-party frameworks, enabling a more fluid and dynamic analytical ecosystem. By implementing a question-and-answer system within these tools, we’ve transformed traditional data analytics into an interactive and insightful experience. Our approach includes training methodologies utilizing synthetic data, which allows us to tailor LLMs for specific vertical use-cases to enhance their applicability and precision.
Paper References
-
Jin, M., Wang, S., Ma, L., Chu, Z., Zhang, J. Y., Shi, X., Chen, P.-Y., Liang, Y., Li, Y.-F., Pan, S., et al.Time-llm: Time series forecasting by reprogramming large language models.In International Conference on Machine Learning, 2024.
-
Lopez-Lira, A. and Tang, Y.Can chatgpt forecast stock price movements? return predictability and large language models.arXiv preprint arXiv:2304.07619, 2023.
-
Liu, X., Hu, J., Li, Y., Diao, S., Liang, Y., Hooi, B., and Zimmermann, R.Unitime: A language-empowered unified model for cross-domain time series http://forecasting.In The Web Conference 2024 (WWW), 2024b.
Additional Resources
- Time-LLM: Repogram an LLM for Time Series Forecasting
-
Leveraging the Power of Large Language Models (LLMs) to Drive Progress in the Manufacturing Sector
- Predictive Maintenance and Generative AI | Waylay Blog
-
LLM Applications are Revolutionizing the Manufacturing Industry
-
https://docs.splunk.com/Documentation/Splunk/9.2.2/SearchTutorial/Createnewdashboard